What metrics should businesses use to account for biodiversity?
The selection of biodiversity metrics is widely debated. Should we focus on pressure indicators? State of nature indicators? Should we use aggregated metrics? How do we balance scientific robustness with operational practicality? The answer depends on the role the metrics are intended to play.
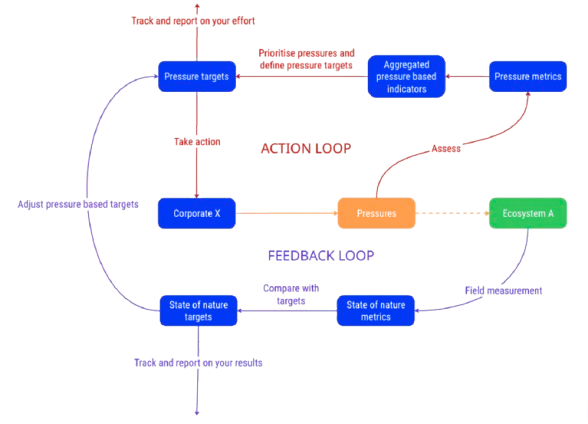
At darwin, we think about it this way: businesses face 2 distinct but interconnected loops—the Action loop and the Feedback loop —each requiring different types of metrics because they serve different purposes.
The Action loop
As its name suggests, this loop is about setting actions in motion. It focuses on pressures. Impacts are estimated rather than directly measured.
In this loop, aggregated pressure-based indicators and associated tools can help businesses identify and prioritise their main pressures and, where possible, the sites that are likely to be most material (their “biodiversity hotspots”). Their role is essential but bounded: they help initiate the transition, not monitor final outcomes.
Some examples of widely used aggregated metrics:
PDF (Potentially Disappeared Fraction of species): estimates the proportion of species locally lost due to environmental pressures per unit area over time.
MSA (Mean Species Abundance): measures ecosystem integrity by comparing species abundance in disturbed areas to undisturbed baselines (scale from 0 to 1).
STAR (Species Threat Abatement and Restoration): quantifies the contribution of specific actions to reducing global extinction risks.
ESII (Ecosystem Services Impact Index): assesses impacts on ecosystem services, factoring in biodiversity and natural capital dependencies.
At darwin, we recommend that businesses use several aggregated indicators to cover the different dimensions of biodiversity (genes, species, ecosystems) and to limit methodological biases.
Conversely, we believe that transition plans, their monitoring and associated reporting efforts should be structured around pressure-level targets and indicators, because pressures are the variables that companies can directly influence.
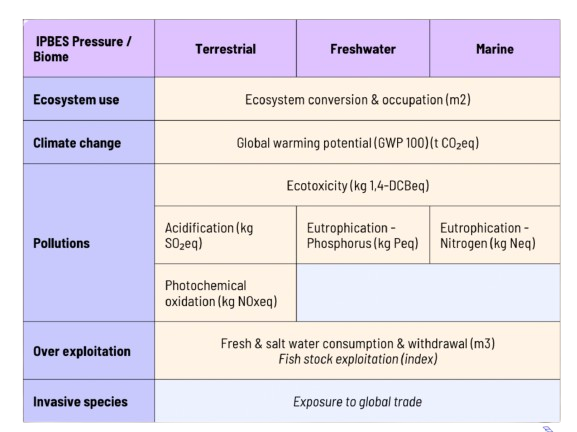
In practice, we suggest focusing on 2–3 key indicators pre pressures, tailored to the business sector and activities. Below, we highlight some pressure indicators we currently use on our platform aligned with SBTN and life cycle assessment (LCA) frameworks, particularly around ecosystem use, water use, and climate change.
Zoom on key pressures and how to measure them
Ecosystem conversion & occupation
Refers to land and sea use changes like deforestation, urbanisation, and seabed disturbance. Measured in m² or hectares of transformed land; coastal area impacted for marine ecosystems.
Global warming potential (climate change)
Refers to GHG-driven climate change disrupting species distributions and ecosystem functions. Measured in kg CO₂-equivalents over 100 years (GWP100).
Ecotoxicity (pollutions)
Refers to emissions of toxic chemicals affecting species health and ecosystems. Measured in 1,4-Dichlorobenzene equivalents (1,4-DCB-eq).
Eutrophication (pollutions)
Refers to nutrient overload leading to aquatic ecosystem collapse. Measured in kg phosphorus-equivalents (P-eq) for freshwater and kg nitrogen-equivalents (N-eq) for marine systems.
Acidification (pollutions and climate change)
Refers to acid rain and soil degradation affecting ecosystems. Measured in kg sulfur dioxide equivalents (SO₂-eq).
Photochemical oxidation (pollutions)
Refers to ozone pollution damaging plants and altering ecosystems. Measured in kg nitrogen oxides equivalents (NOₓ-eq).
Overexploitation
Refers to unsustainable use of biological resources (overfishing, logging, water extraction). Water use is measured in cubic meters (m³), complemented by indices on fisheries stock exploitation aligned with new SBTN Oceans targets.
Invasive species
Refers to the spread of non-native species disrupting native ecosystems. We use proxies like exposure to global goods transport and trade flows to assess potential risks.
At darwin, we advocate on focusing on those pressure-level indicators, as they provide actionable insights for businesses.
The Feedback loop
Then, the feedback loop aims to ensure that the actions taken by businesses and other stakeholders actually deliver the expected results at the ecosystem level.
Here, the focus shifts from pressures to the state of nature. Impacts are measured directly.
Because biodiversity is complex and context-specific, multiple types of indicators are needed. Some examples of state indicators include:
Species richness and abundance surveys (e.g., number of bird species in a site)
Habitat condition assessments (e.g., vegetation cover, water quality indices)
Red List status changes (e.g., proportion of threatened species over time)
Freshwater quality indicators (e.g., nutrient levels, oxygenation)
Landscape connectivity metrics (e.g., habitat fragmentation indices)
It’s important to note that setting targets related to the state of nature only makes sense at the ecosystem or landscape level—and only if a significant portion of the stakeholders impacting that system are also engaged. No single company can "save" an ecosystem alone; success depends on collective action.
For businesses, 2 immediate and essential priorities stand out:
Launch action by developing transition plans focused on reducing pressures, grounded in scientific guidance.
Strengthen the feedback loop by gradually investing in ecosystem monitoring and traceability initiatives.
It’s perfectly acceptable to move forward despite uncertainty—what matters is ensuring that the company is heading in the right direction, guided by science and common sense.
In biodiversity, waiting for perfect data means waiting too long. The time to act is now.


